Content Analytics
Content analytics scores file viewing so you can see which materials helped a client project move. There is no extra sidebar item; it appears in Insights, file analytics, and workspace settings.
In this article: Reviewing on Insights / Reviewing in file analytics / Per-page heatmap / How scoring works / Customizing settings
Reviewing on Insights
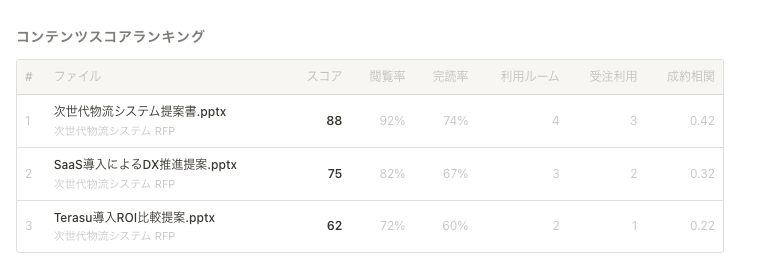
Insights shows How materials performed.
| Column | Description |
|---|---|
| File | Filename |
| Rooms used | How many Rooms use it |
| Completion rate | How often it was read through |
| Time per Room | Viewing time per Room |
| Rooms that moved | Rooms where the project moved forward |
Calculating a score requires a certain amount of viewing data. While data is still limited, you'll see "No viewing data yet."
Reviewing in File Analytics
Each file's analytics screen shows a "Content score" summary at the top.
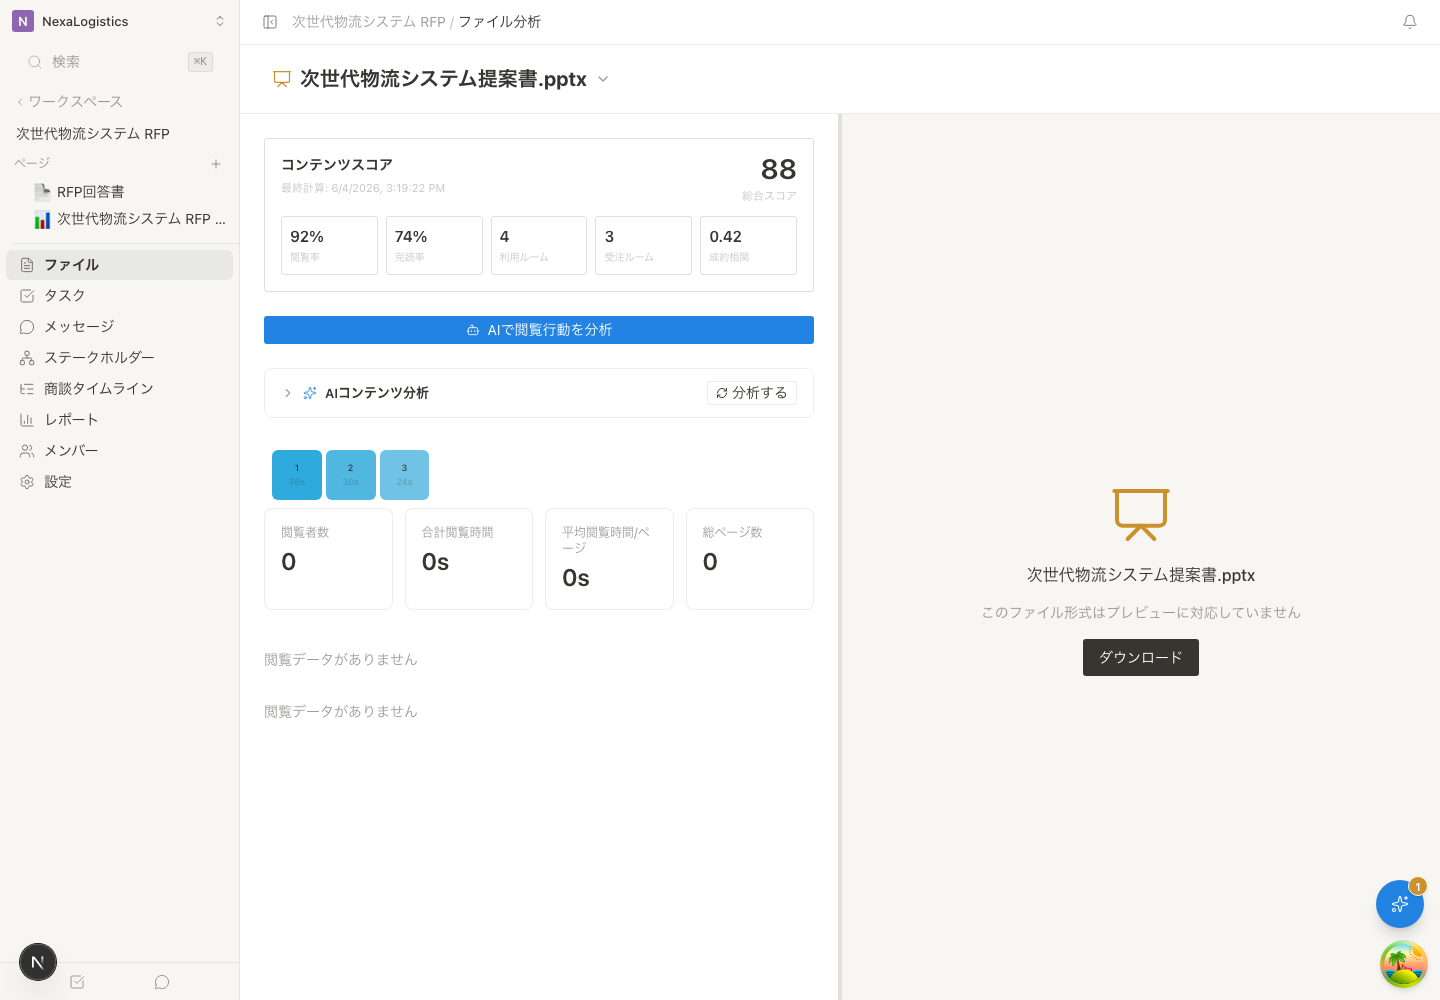
| Item | Description |
|---|---|
| Overall score | A 0–100 score calculated from the configured scoring weights |
| Last calculated | The last time the score was updated by batch processing or recalculation |
| View rate / Completion rate | How often customers opened the file and reached the final page |
| Rooms used / Rooms that moved | Display-only context for how broadly the file is used across client projects, including rooms that moved forward |
AI viewing behavior analysis explains how this Room read the file in natural language. Content score is a cross-Room metric for understanding how much the material contributes to outcomes. The score itself uses the five configured metrics described below: view rate, average viewing time, completion rate, download rate, and progress correlation.
Per-Page Heatmap
On the file analytics page, the average viewing time for each page is shown as a heatmap.
- Color intensity: The darker the color, the longer the average viewing time for that page
- Values: Displays the page number and average viewing time (in seconds)
- Reach rate: In the list view, you can also check each page's reach rate as a bar
Pages with longer viewing times are areas of high interest in your content. Identify which parts of your proposal resonate, and apply those insights to your next client project.
How Scoring Works
Each file's score is a weighted sum of the following five metrics.
| Metric | Default weight |
|---|---|
| View rate | 25% |
| Average viewing time | 20% |
| Completion rate | 25% |
| Download rate | 10% |
| Progress correlation | 20% |
Customizing Settings
You can change the weight of each metric from Workspace settings → Project analytics → Content Intelligence. Only workspace admins can open this page. If loading fails, use Retry. After you change a value, Save settings becomes available. When nothing has changed, the reason "Make a change to save" is shown.
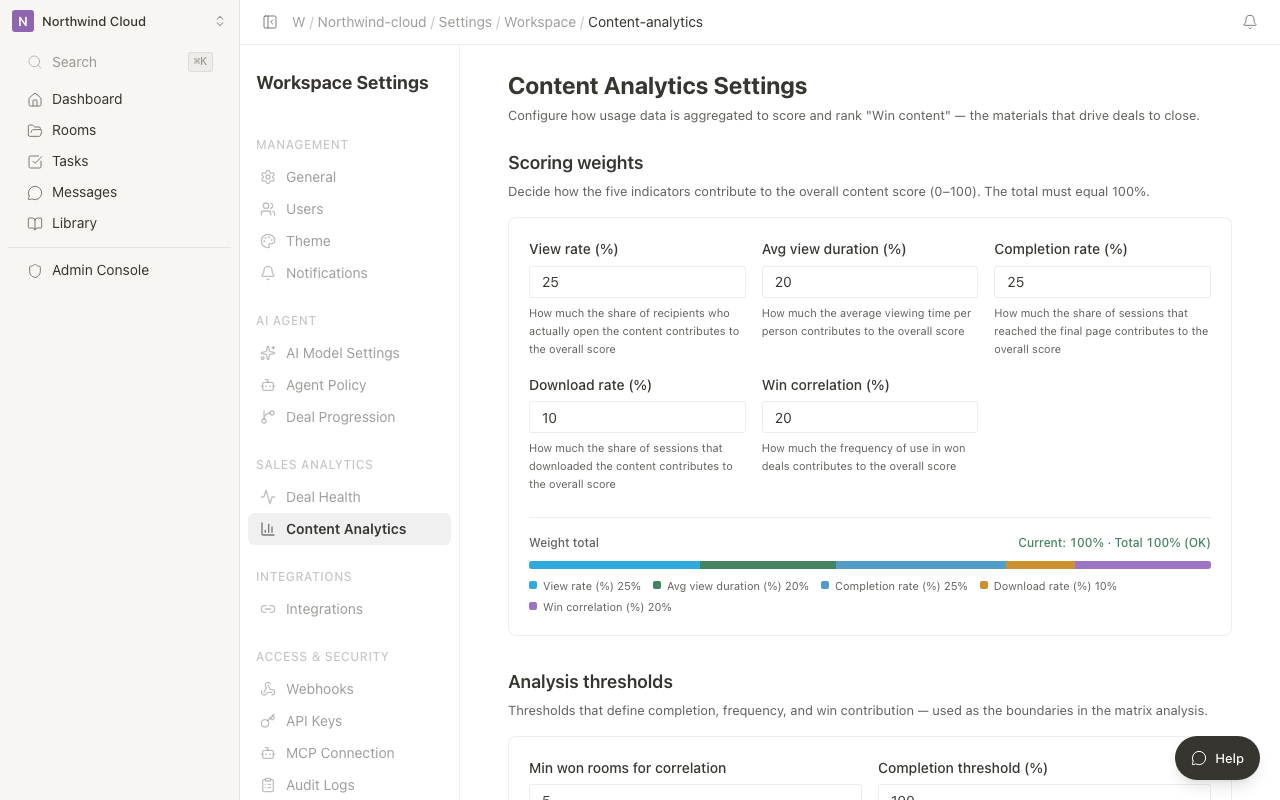
Scoring Weights
Set the weight of the five metrics as percentages. Adjust them so the total adds up to 100%.
Analysis Thresholds
| Setting | Description | Default |
|---|---|---|
| Minimum data count for progress correlation | The minimum sample size needed to calculate correlation | 5 |
| Completion threshold | What percentage of the final page counts as completed | 100% |
| High-accuracy boundary | The threshold at which a score is considered high-accuracy | 50% |
| High-contribution boundary | The threshold at which progress correlation is considered high-contribution | 0.3 |
Lowering the "Minimum data count for progress correlation" allows correlation to be calculated with less data, but accuracy will be lower. We recommend using it only after enough data has accumulated.