File Viewing Analytics
You can analyze the viewing activity of PDF and video files in detail. PPTX, DOCX, Keynote, and Pages files are viewed through a PDF-converted preview, so per-page records are kept the same way as PDFs. This article covers the following.
- Per-page/segment heatmap (visualizing viewing time)
- Content score (cross-Room material performance)
- Per-member view history
- AI viewing behavior analysis (AI-driven behavioral insights and suggested actions)
- AI content analysis (automatic AI-generated page labels)
How this differs from AI analysis in the file list
The viewing analytics covered on this page records and visualizes who viewed a material and how long they spent on each PDF page or video segment.
AI analysis in the file list is a separate process that makes the contents of PDF, DOCX, XLSX, and PPTX files available to the AI Agent. It does not analyze viewer behavior. For supported formats, statuses, and retry instructions, see Uploading Files.
Preview generation is also a separate process. If AI analysis fails or is not supported, it does not affect previewing, sharing, or viewing-log collection for otherwise supported files.
How Viewing Tracking Works
When a file is displayed in the viewer, the following data is automatically recorded.
- The page number viewed (PDF, or preview-converted PPTX / DOCX / Keynote / Pages) / playback segment (video)
- The viewing time of each page or segment (in seconds)
- The viewing date and time
- Viewer information
Tracking data is sent to the server every 5 seconds. Even if the browser is closed, the final data is sent automatically.
Opening the File Analytics Screen
- Click a file in the "Files" tab within a Room
- Click the "Analytics" button
- The file preview and the analysis panel appear side by side
PDF Analysis
Content Score (PDF Only)
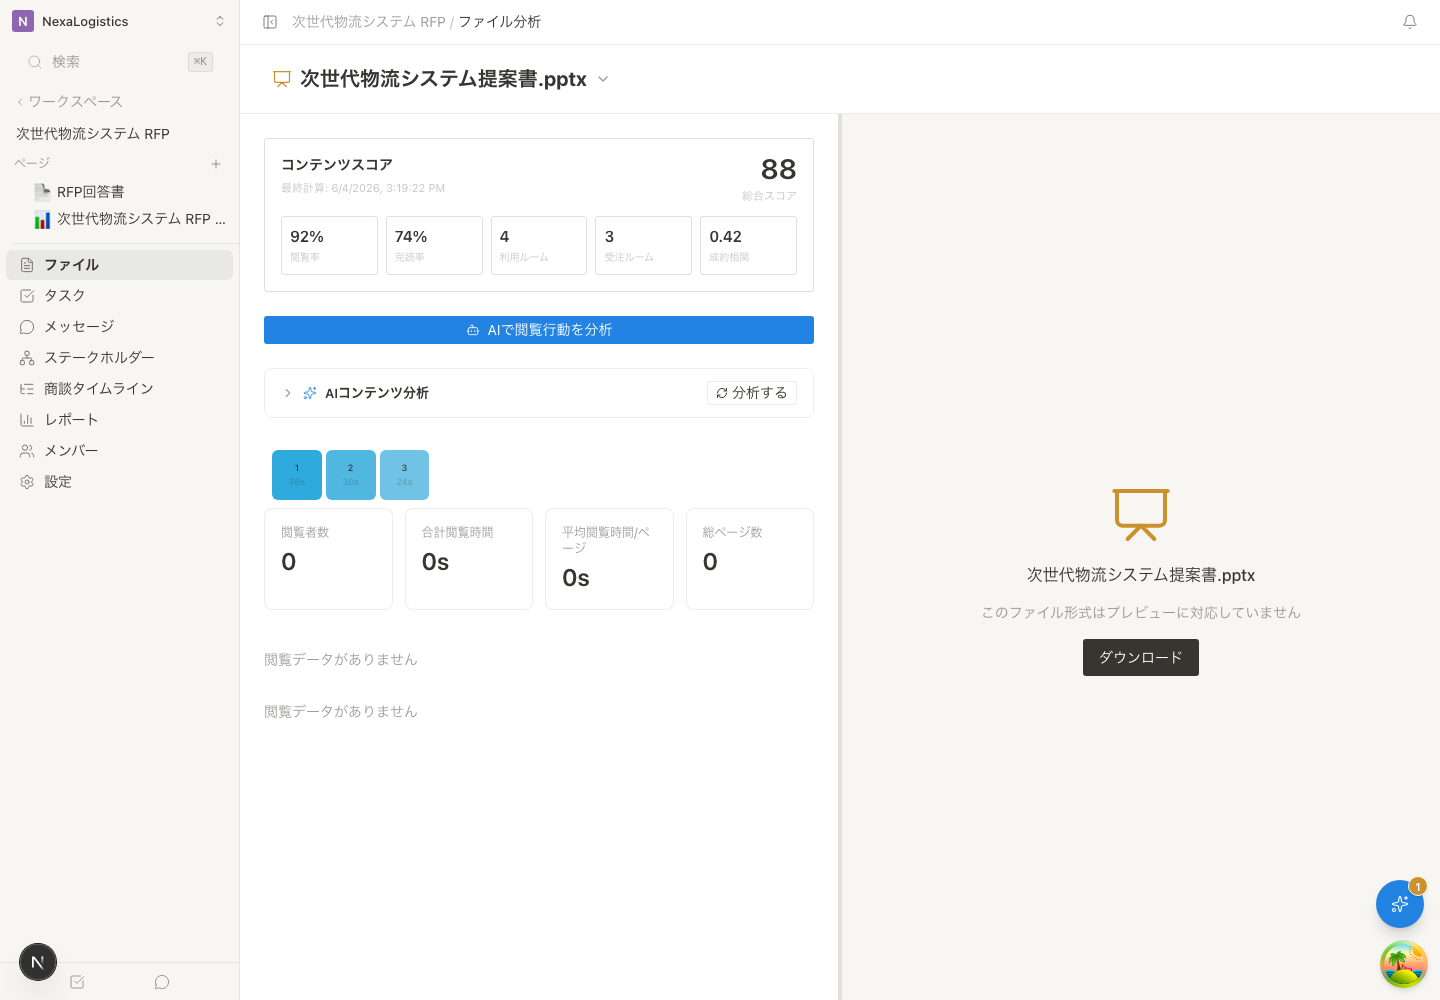
On Business plans and above, the file analytics screen shows a "Content score" summary at the top.
| Item | Description |
|---|---|
| Score | Overall 0–100 evaluation |
| View rate | The percentage of viewers who opened the file |
| Completion rate | The percentage who reached the final page |
| Rooms used | The number of Rooms where the file has been used |
| Completed rooms | Rooms of completed client projects that used the file |
| Project correlation | Correlation with completed client projects |
Content score is calculated across multiple Rooms. To understand behavior inside a single Room, use AI viewing behavior analysis on the same screen.
Per-Page Heatmap
The total viewing time for each page is shown as a heatmap. The darker the color, the longer the viewing time.
| Item | Description |
|---|---|
| Viewing time per page | The total time spent on each page |
| View count per page | The number of times each page was displayed |
Click a page on the heatmap to jump to that page in the preview.
PPTX, DOCX, Keynote, and Pages files are also viewed through a PDF-converted preview, so the per-page heatmap is available for them in the same way.
Video Analysis
Per-Segment Heatmap
The video is divided into 60-second segments, and the watch time for each segment is shown as a heatmap.
| Item | Description |
|---|---|
| Watch time per segment | The total watch time for each 60-second bucket |
| Play count per segment | The number of times each segment was played |
Click a segment on the heatmap to seek to that point in the preview.
Per-Member View History
| Item | Description |
|---|---|
| Viewer name | The member who viewed the file |
| Viewing date and time | The date and time of access |
| Viewed pages / segments | The range that was viewed |
| Total time | The total viewing time for that session |
AI Viewing Behavior Analysis
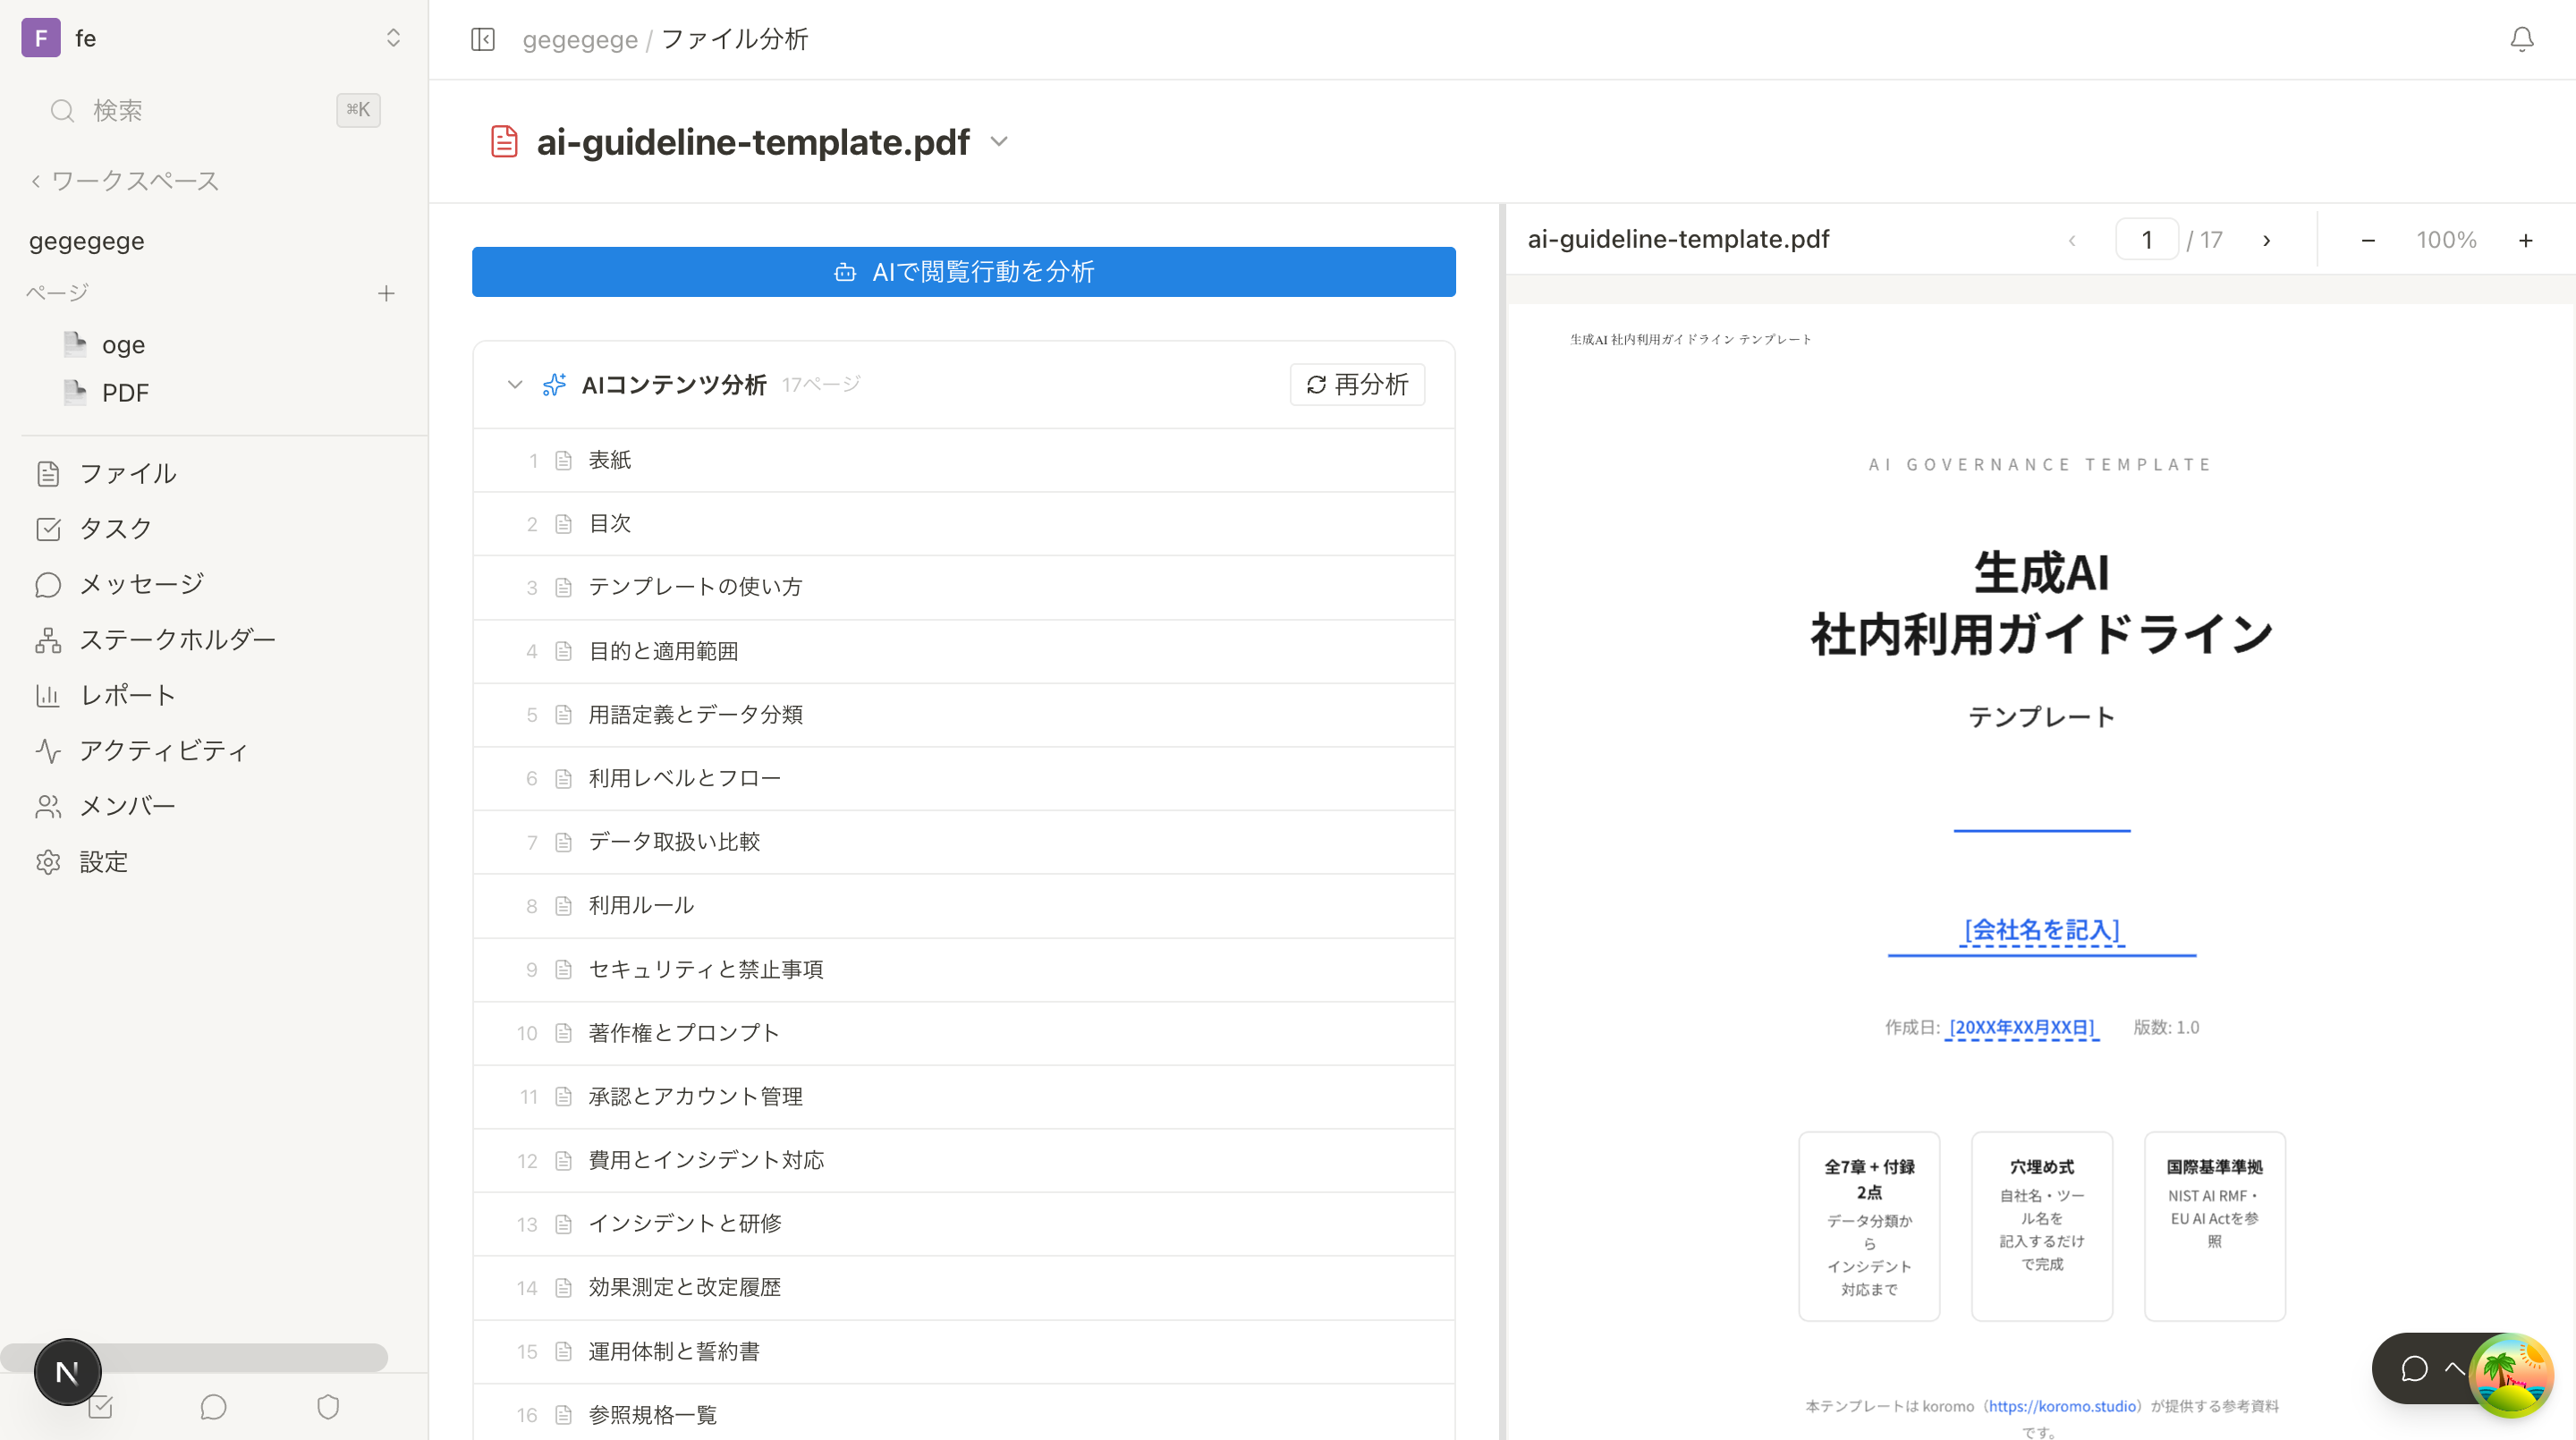
When you click the "Analyze viewing behavior with AI" button on the file analytics screen, the AI analyzes the viewing data and summarizes, in natural language, with what intent and interest the material was read.
Understanding the Results
| Item | Description |
|---|---|
| Insight summary | A summary of the customer's interests and evaluation stage as read from the viewing patterns |
| Suggested actions | A list of follow-up actions the AI recommends |
Converting Suggested Actions into Tasks
Click the "+" button to the right of each item in the suggested actions list to instantly add that action as a task.
A suggestion like "They have spent a long time on the pricing page. It would be good to follow up about a quote" serves as a hint so you don't miss the moment to move the client project forward.
AI viewing behavior analysis requires a certain amount of viewing data. If there are few viewing logs, it will be shown as insufficient data. You can refresh the analysis results at any time.
AI Content Analysis (PDF only)
When you click the "Analyze" button in the "AI Content Analysis" section, the AI reads the content of each page of the PDF and automatically generates a label (description) for each page.
How to Use
- Open the "AI Content Analysis" accordion on the file analytics screen
- Click the "Analyze" button
- While analyzing (about a few dozen seconds), "Analyzing..." is displayed
- When complete, labels appear in the page list
Page Label List
| Item | Description |
|---|---|
| Page number | The page number in the PDF |
| Label | The AI-generated description of that page's content |
Click a page label to jump to that page in the preview.
By combining page labels with the heatmap, you can pinpoint exactly "which topics" hold the customer's interest. For example, if a page labeled "Pricing comparison page" has a long viewing time, providing competitive comparison information may be effective.
If you update an already-analyzed PDF, you can refresh it with the "Re-analyze" button. Page-label generation on this screen supports PDF files only. AI analysis in the Room's file list is a separate feature that also supports DOCX, XLSX, and PPTX. Per-page viewing analytics supports PDFs and videos as well as preview-converted PPTX, DOCX, Keynote, and Pages files; for files without preview conversion, such as XLSX and images, only the view count is recorded.
For videos, segments that are watched repeatedly are areas of especially high customer interest. Consider sending additional material that explores those topics in more depth.
Related articles
- Understanding the Engagement ReportHow to use the report to see what customers confirmed, when, and for how long
- Project HealthHow to use AI-powered project health scoring to detect stalls and risks early
- Content AnalyticsHow to identify your most effective content by scoring files and analyzing viewing patterns
- Uploading FilesHow to upload and share Room files, understand supported AI analysis formats and statuses, retry analysis, and manage permissions