Understanding the Engagement Report
The report shows what customers confirmed, when, and for how long, and whether the client project is moving forward, from the top of the page down.
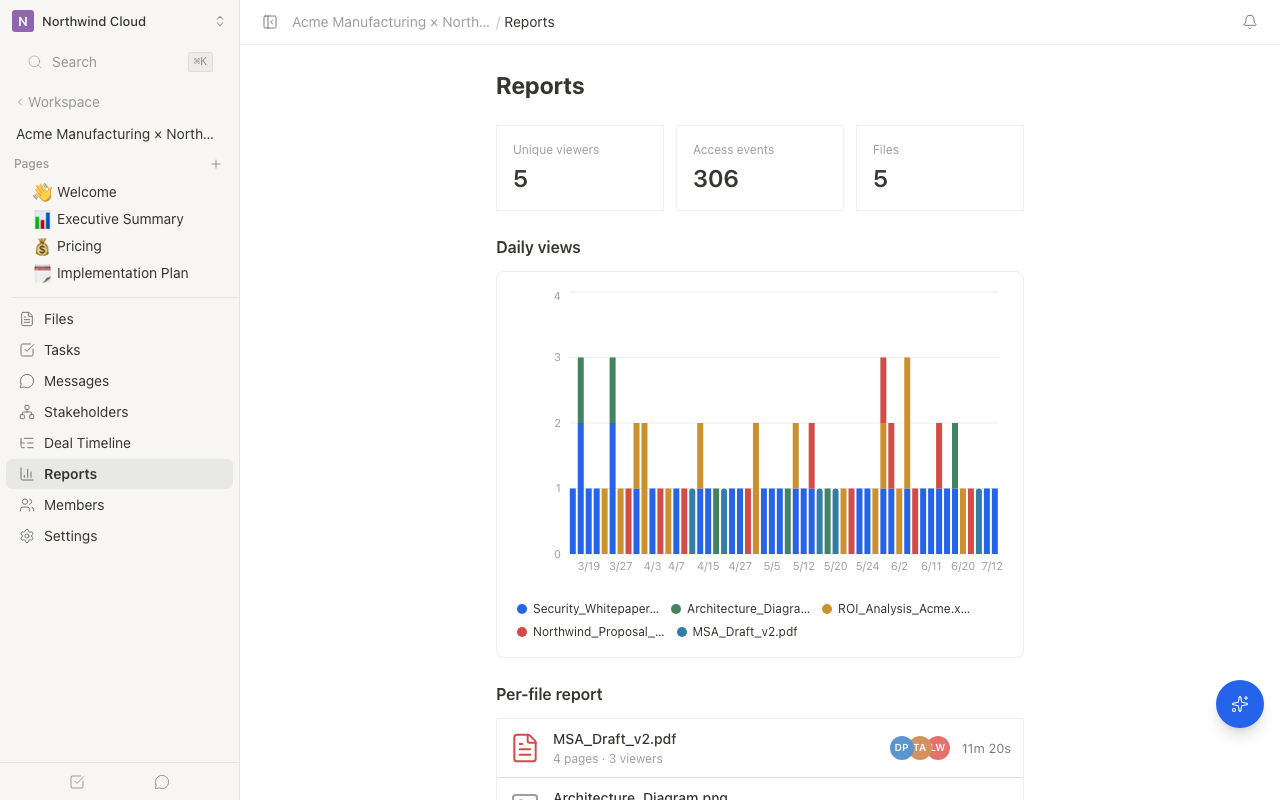
Accessing the Report
- Open the Room
- Click "Reports" in the left menu
- Choose a period (7 days / 30 days / 90 days / All)
Analytics data is visible only to internal owners and editors. It is not visible to external customers.
Disabled actions show a reason. "Summarize with AI" is not ready yet. "CSV" is available after the report has loaded.
Status summary
The top of the page shows stall risk / on track, last access (external members only), and unread-material chips. Last access does not include internal members.
| Action | Description |
|---|---|
| Draft AI action | Shows a reason when the feature is not ready |
| Resend share link | Use the share-link screen |
Report metrics
| Metric | Description |
|---|---|
| External viewers | External members who reviewed in the period |
| Viewing time (in period) | How long customers spent on materials, with a previous-period comparison |
| Material confirmation | How many items were read through |
| Project health | Evaluating, or a score |
Confirmation by material
Each row shows the file, status, read-through, viewers, duration, last viewed, and actions. Click the file name to open that file's viewing detail. "Details" in the actions column appears even for unviewed files, alongside "Send share link".
Engagement by member
See which customers are moving. Opening a name, or "Details" at the end of the row, goes to that person's member report. Segments are External / Internal / All.
Member report
The member report shows viewing time, visit count, file count, and per-page dwell. Expanding a row reveals page dwell. You can also open file-level detail.
Materials with longer viewing times are where the customer spent time confirming. Use that to prioritize the next step.
Putting the data to use
- Priority: Customers who check often are ready to talk now
- Content: Consider revising pages with short viewing times
- Follow-up timing: Reach out based on last access
Relationship to Project Health
On Business plans and above, "Project Health" also appears on the same report page. The engagement report shows behavioral data such as views and viewing time, while Project Health turns that data into a score for stalls and risk.
| What you want to check | Where to look |
|---|---|
| Who viewed which materials and for how long | Reports (this screen) |
| Whether the project is on track or needs attention | Project Health |
| Whether there is a risk that needs immediate action | "Alerts" on the report |
When an alert appears, use "Draft AI action" to create a next-action proposal. For triage across Rooms, use the workspace Agent Inbox.
Related articles
- File Viewing AnalyticsHow to use PDF and video viewing analytics, heatmaps, AI viewing insights, and distinguish them from file-list AI analysis
- Project HealthHow to use AI-powered project health scoring to detect stalls and risks early
- Content AnalyticsHow to identify your most effective content by scoring files and analyzing viewing patterns